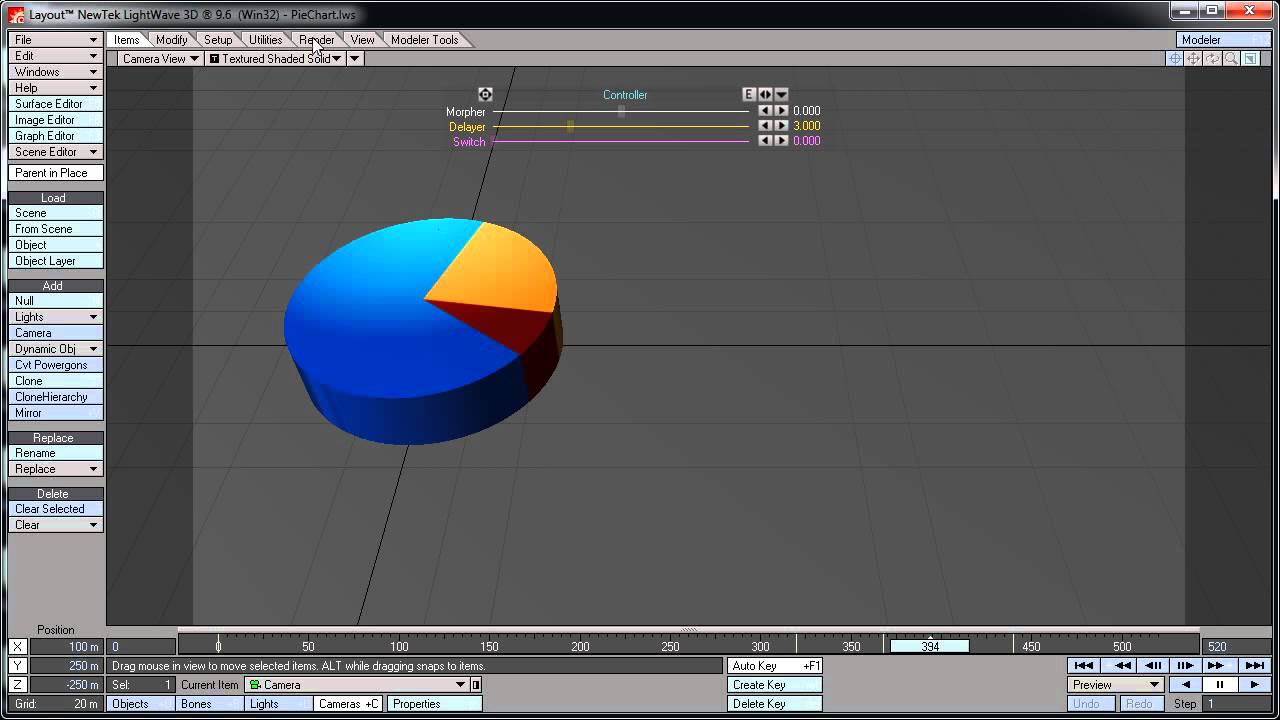
In the second and final part of this two day tutorial, Joshua Jorgensen will take us through the process of creating a motion graphics style effect to animate a pie chart scene. Using a combination of keyframing and expressions in Lightwave 3D, we'll build a flexible semi-automated system to create an impressive effect out of what would normally be a boring statistic!
Additional Files/ Plugins:The tutorial will cover the entire process from start to finish, including modeling, layout, animation, texturing, and compositing. Intermediate knowledge of Lightwave as well as basic knowledge of After Effects are required to complete this tutorial.
Note: click the 'Monitor' icon to view tutorial in full-screen HD.
Did you find this post useful?
Want a weekly email summary?
Subscribe below and we’ll send you a weekly email summary of all new Design & Illustration tutorials. Never miss out on learning about the next big thing.
Sign up

One subscription. Unlimited Downloads.