

How to style jqPlot, and format labels
I just had to style jqPlot for inclusion in a darkly styled site. Not the easiest as some things can be styled via CSS whereas some things need to be styled via the jqPlot options.
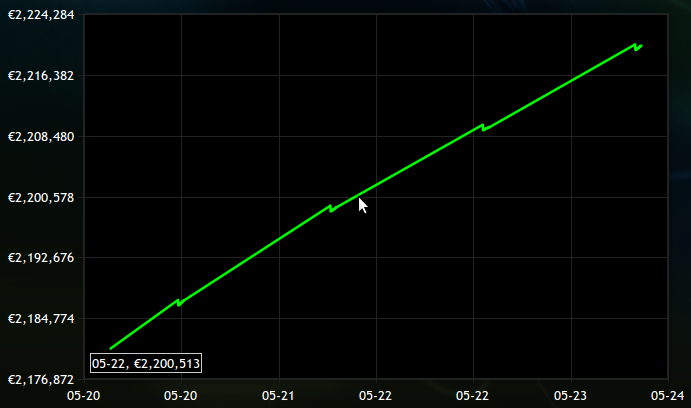
Furthermore, it doesn’t help that many style and formatting options are not very well documented. Finally though I managed to piece together all I needed to know in order to get the result I wanted. Click the picture to the right to see the final result.
To get the whole picture of what needs to be done we need to look at 3 things, my CSS file, the jqPlot options and the custom formatter I had to create/rip.
A lot of code displayed here is not explained, read the prior jqPlot article for more background.
Let’s start with the CSS:
.jqplot-target {
    position: relative;
    color: #fff;
    font-family: "Trebuchet MS", Arial, Helvetica, sans-serif;
    font-size: 18px;
}

.jqplot-axis {
    font-size: 0.75em;
}

.jqplot-xaxis {
    margin-top: 10px;
}

.jqplot-yaxis {
    margin-right: 10px;
}

table.jqplot-cursor-tooltip {
    border: 1px solid #cccccc;
    font-size: 0.75em;
}

.jqplot-cursor-tooltip {
    border: 1px solid #cccccc;
    font-size: 0.75em;
    white-space: nowrap;
    background: rgba(0, 0, 0, 1);
    padding: 1px;
}
Much of the above is default values from the default jqPlot CSS file. As you can see I’ve changed some color values to create black backgrounds and white text.
Next up is the jQuery/JavaScript:
<link rel="stylesheet" type="text/css" href="/project/css/jquery.jqplot.css" />
<script type="text/javascript" src="/project/js/jqplot/jquery.jqplot.min.js"></script>
<script type="text/javascript" src="/project/js/jqplot/plugins/jqplot.euroFormatter.js"></script>
<script type="text/javascript" src="/project/js/jqplot/plugins/jqplot.dateAxisRenderer.min.js"></script>
<script type="text/javascript" src="/project/js/jqplot/plugins/jqplot.canvasTextRenderer.min.js"></script>
<script type="text/javascript" src="/project/js/jqplot/plugins/jqplot.canvasAxisTickRenderer.min.js"></script>
<script type="text/javascript" src="/project/js/jqplot/plugins/jqplot.highlighter.min.js"></script>
<script type="text/javascript" src="/project/js/jqplot/plugins/jqplot.cursor.min.js"></script>

<script>
$(function() {
	<?php if(!empty($this->json)): ?>

	$.jqplot.config.enablePlugins = true;
	$.jqplot("chartdiv",  <?php echo $this->json ?>, {
		seriesColors: ["#0f0"],
		legend: {show:false},
		series: [
					{showMarker:false},
				],
		axes: {
			xaxis: {
				borderColor: "#222",
				renderer: $.jqplot.DateAxisRenderer,
				tickOptions:{formatString:'%m-%d', textColor: "#fff"},
				rendererOptions:{tickRenderer: $.jqplot.CanvasAxisTickRenderer},

			},
			yaxis: {
				autoscale:true,
				borderColor: "#222",
				tickOptions: {formatString:'%d', formatter: $.jqplot.euroFormatter}
			}
		},
		highlighter: {show: false},
		cursor: {tooltipLocation:'sw'},
		grid: {background: '#000', gridLineColor: '#222', borderColor: '#222'}
	});

	<?php endif ?>

});
</script>
First note the seriesColors color value. That’s how we get the green graph. Then we have the xaxis/yaxis borderColor that we set to a very dark gray to prevent these lines from distracting from the important stuff. Note the euroFormatter we’re using for the y-axis. We’ll get to that one shortly. I’ve set the formatString to %d to get an integer as I don’t want to display any floating point numbers, also, more on that below.
Finally we have the grid options. Line colors are set to a very dark gray, so are border colors, naturally we have a black background.
Let’s take a look at the aforementioned euro formatter:
(function($) {
    $.jqplot.euroFormatter = function (format, val) {
        if (!format) {
            format = '%.1f';
        }
        return '€'+numberWithCommas($.jqplot.sprintf(format, val));
    };

    function numberWithCommas(x) {
        return x.toString().replace(/\B(?=(?:\d{3})+(?!\d))/g, ",");
    }
})(jQuery);
The above is basically ripped from code posted here.
Note how I added the euro sign in front of the formatted number, also note that format will be %d as per the passed options to jqPlot.